A histogram is a bar chart that shows you whether a photographs exposure is good or bad. You can view the histogram on your camera’s LCD screen after you have taken the shot. A histogram looks similar to the image shown below.
If you see high peaks on the right side of the histogram, this indicates the photograph may be too bright or overexposed. On the other hand, if there are high peaks on the left side of the histogram, the image is most likely too dark and underexposed. If the peaks are centered like in the example above, the photo is said to be well balanced and exposed. That is, not too dark or too light.
Reasons why photographers should view the photo’s histogram
- While it’s true that some photographs are obviously too light or too dark when viewing them back on your camera’s LCD screen, other images may not be so clear. I can’t count the times I’ve viewed the perfect image on my small LCD screen, to find they are badly exposed when seeing them on my 19 inch computer monitor.
- It is especially important to check the histogram if the photograph is taken from a once in a lifetime moment. Recently I took some photographs down at our local harbor side marina. The morning was perfect, there wasn’t a ripple in the water and the reflections were crystal clear. It was one of those moments we may not see again for a long time. Therefore it was important to ensure the exposures were correct in the histogram before packing up and heading home. If the histogram showed any under or over exposure, I would have taken the shot again while I had the chance.
Where to find the histogram graph on your digital SLR camera?
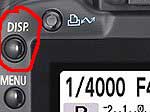
If you are using a Canon 400D SLR camera, view a photograph in your LCD screen, then press the DISP button twice, on the top left near the LCD screen. You should then see the histogram. Once you’re done, press the DISP button again to get back to the previous screen.
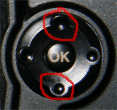
For Nikon D40 users, view an image in your LCD screen, then press the up and down buttons near the ‘Ok’ to scroll to the histogram.
All other users, check your camera manual.
Histogram examples
As you can see by the image below, it was underexposed (too dark). There is very little detail seen in the tree’s, footpath and two people on the left.
Shown below, is the histogram for the underexposed image. As you can see by this example, the high peaks are on the left hand side of the graph.
In contrast, the photograph below is overexposed (too light).
Shown below, is the histogram for the overexposed image. Notice this time, the high peaks are on the right hand side of the graph.
What you should be aiming for, is a histogram that displays the majority of peaks within the center of the graph.
Exceptions to the rule
There are times when it’s perfectly acceptable for the graph to display high peaks at either end of the histogram.
- For instance, if there is naturally a lot of white within the scenery (snow shots), then you would see high peaks on the right side of the histogram, even when the photo is perfectly exposed.
- On the other hand, if there is a lot of black within the scenery or object you are photographing, then the high peaks would naturally occur on the left hand side of the graph.
- Furthermore, if there is a good mixture of black and white within the scenery, you may find high peaks at both ends of the histogram.
Photography Assignment – Grab your DSLR camera and give this a try
It’s important to understand histograms and how different sceneries can effect how the graph looks. Once you understand this information, you’ll instantly be able to recognize if a photograph is under or over exposed when viewing it in your tiny LCD screen.
To follow this assignment, you need to know how to display a photographs histogram within your camera’s LCD screen. I’ve listed instructions for Canon 400D and Nikon D40 users in the article shown above, under the heading ‘Where to find the histogram graph on your camera‘. For all other models and brands, check your camera’s manual.
Assignment: A lesson in reading histograms.
- Take a photograph of an object or person against a dark background. For this example, it’s important to make sure a dark color dominates much of the composition. View the photo’s histogram and you should notice high peaks towards the left side of the graph. Its important to understand that in this case, the peaks on the left hand side are due to there being a lot of black within the photograph. Not necessarily because it is underexposed.
- Alternatively, take a photograph of an object where there is a dominance of white coloring within the composition. When viewing the images histogram, you should notice the high peaks positioned on the right side of the graph.
- For a third example, photograph a black object on a white background. This time when you view the histogram you’ll notice there are peaks at both ends of the graph.
This exercise was important to help demonstrate other reasons why you could see high peaks on either end of your histogram graph. They may not always mean your image was exposed incorrectly.
Therefore, when you view your histogram, it’s also vital that you analyze any other reasons why you may see uneven peaks. After all, you don’t want to delete a perfectly good photo!


